Real Estate Sales
The June Report was publish on June 19, 2020 for the real estate sales for the month of May 2020. The data includes the average price per square meter for listings in the Kansai region in one data set. The Kansai region includes Wakayama, Osaka, Nara, Hyogo, Kyoto, and Shiga Prefectures.
Data for Real Estate Sales will not included new construction.
The Data will be broken down into three categories:
- Condominium Sales
- House Sales
- Land Sales
Sub categories will include units sold and the number of new listings to hit the market.

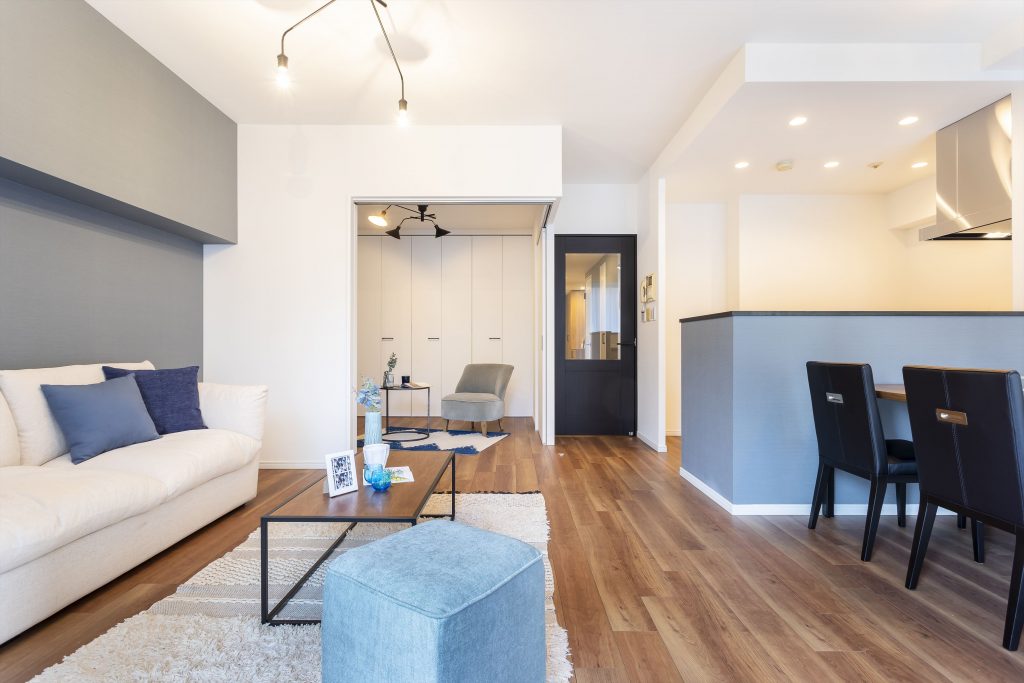
1.Condominium Sales
Kansai Region
Units Sold
May 2020: ¥303,000 per square meter a total of 764 units sold
May 2019: ¥326,000 per square meter a total of 1,132 units sold
Year-over-year change of -7.1% per square meter
Month-to-month change of -6.8% per square meter (April to May 2020)
New Properties Listed
May 2020: ¥386,000 per square meter a total of 5,481 units listed
May 2019: ¥361,000 per square meter a total of 5,095 units listed
Year-over-year change of 6.9% per square meter
Month-to-month change of 0.4% per square meter (April to May 2020)
Osaka City
Units Sold
May 2020: ¥417,000 per square meter a total of 190 units sold
May 2019: ¥435,000 per square meter a total of 292 units sold
Year-over-year change of -4.2% per square meter
Month-to-month change of -10.2%per square meter (April to May 2020)
2.House Sales (Detached Homes)
Kansai Region
Homes Sold
May 2020: average price of ¥18,660,000 for a total of 681 houses sold
May 2019: average price of ¥20,930,000 for a total of 731 houses sold
Year-over-year change of -10.8% (average price)
Month-to-month change of -0.8% ( average price for March to April 2020)
New Properties Listed
May 2020: average price of ¥25,410,000 for a total of 3,453 houses listed
May 2019: average price of ¥24,940,000 for a total of 3,541 houses listed
Year-over-year change of 1.9% (average price)
Month-to-month change of 1.0% (average price for February to March 2020)
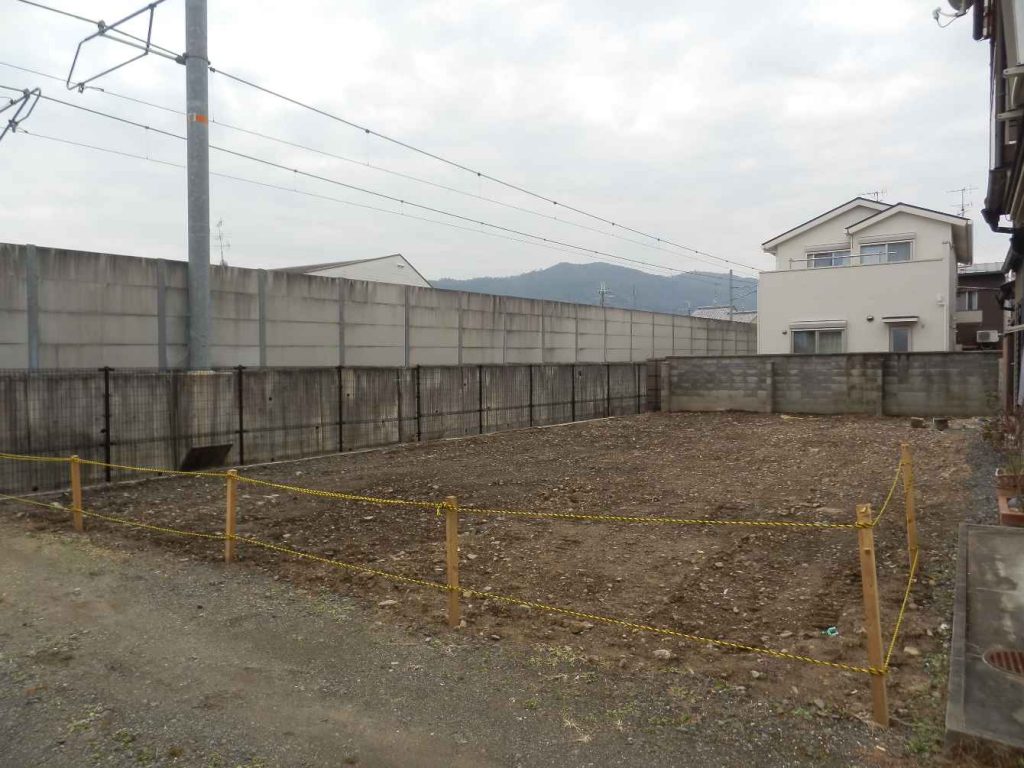
3.Land Sales
Kansai Region
Lots Sold
May 2020: ¥114,000 per square meter a total of 425 lots sold
May 2019: ¥117,000 per square meter a total of 492 lots sold
Year-over-year change of -2.4% per square meter
Month-to-month change of -1.9% per square meter (April to May 2020)
New Lots Listed
May 2020: ¥134,000 per square meter a total of 3,780 lots listed
May 2019: ¥126,000 per square meter a total of 3,652 lots listed
Year-over-year change of 6.7% per square meter
Month-to-month change of 2.8% per square meter (April to May 2020)
Northern Osaka (Hokusetsu Area)
Lots Sold
May 2020: ¥178,000 per square meter a total of 50 lots sold
May 2019: ¥214,000 per square meter a total of 40 lots sold
Year-over-year change of -16.9% per square meter
Month-to-month change of -6.5% per square meter (April to May 2020)

Recap
The number of transactions are still down compared to the previous years month (May 2019) with the number of transactions down compared with the previous month (April 2020).
Comparing the number of transaction to the previous year 2019;
Condominium sales were down 32.5%
House sales were down 6.8%
Land sales were down 13.6%
There has been a slight increase in new inventory compared with the previous month (April 2020);
Up from 5,007 to 5,481 (condominiums)
Up from 3,323 to 3,453 (detached houses)
Up from 3,770 to 3,780 (land)
For additional information please contact us here
Email: info@remax-apex.com
For the original data in Japanese clink here → Kinki Reins


