Declining Birthrate and the Aging Society
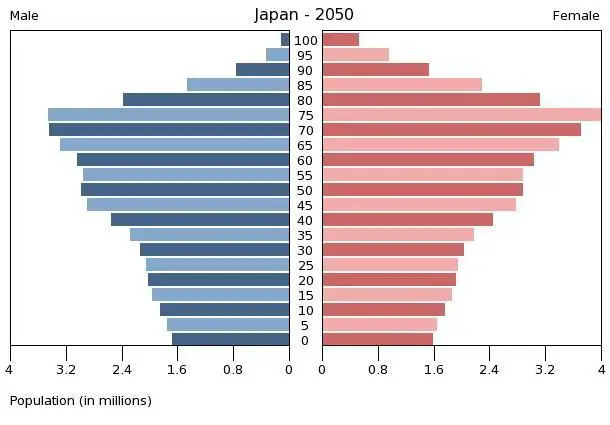
The population of Japan is 125.47 million as of December 2021.
Within the entire population, the elderly population (those 65 years old and over) is 36.24 million (the highest ever), accounting for 28.9% of the total.
This has made headlines for quite a while, so of course you are all familiar with this phenomenon.
On the other hand, in terms of the declining birthrate situation, the decline in the total fertility rate continues unabated.
The total fertility rate is a numerical value which indicates the number of children a woman gives birth to in her lifetime, which was 1.36 in 2019.
Using this numerical value as the standard, Japan’s population will not increase in the future unless the figure is higher than 2.00.
Graphic 1: Annual Changes in the Number of Births and the Total Fertility Rate
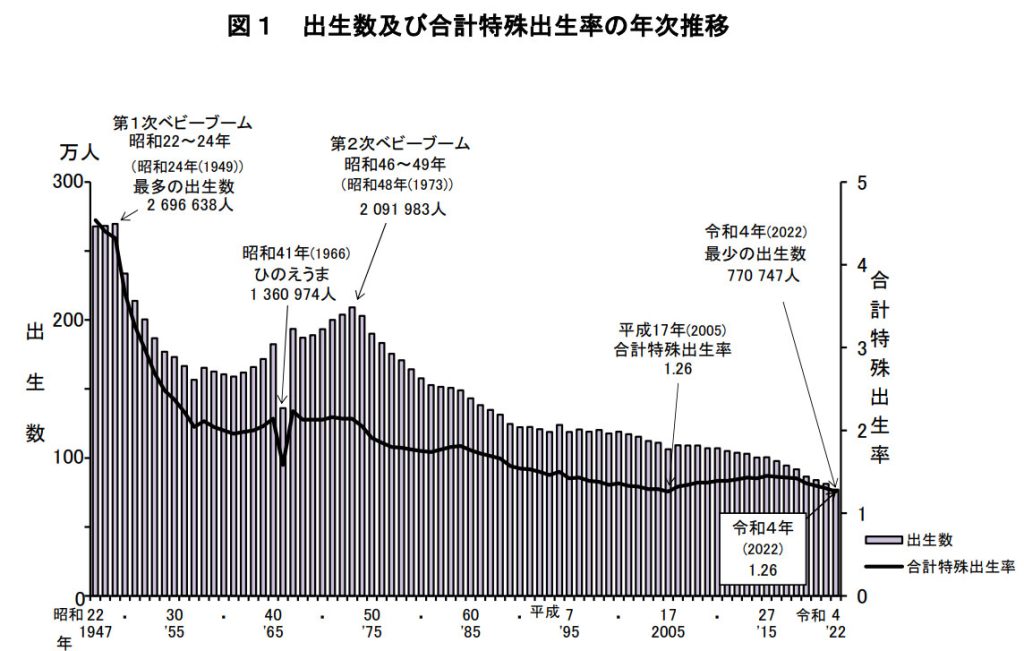
This is clear from the data released by the Ministry of Health, Labor and Welfare.
Around 1947-1949, called the first baby boom, the number of births reached a record high of 2,696,638. This is the era of the so-called Baby Boomer Generation where the total fertility rate at during time exceeded 4.00. One couple had four or more children, so the population increased.
During the second baby boom, from 1971 to 1974, the total fertility rate exceeded 3.50.
This era was called the Baby Boomer Junior Generation, and the number of births per year during this era exceeded 2 million.
However, the exchange rate changed to a floating exchange rate system in 1971, and the oil crisis broke out in 1973, which marked the end of the era coined the high growth period.
Until then, the exchange rate was 360 yen per US Dollar.
In the export industry, the more we exported, the more profitable it was.
If the economy is profitable and the economy is booming, the birth rate and the number of births will increase, naturally.
After the period of rapid economic growth ended, the birth rate and the number of births dropped significantly. The number of births fell below 1 million every year, and in 2020, the number of births was 770,747, the lowest number ever.
The problem lies in social security costs.
Expenditures will continue to grow, while income is expected to decline as the percentage of working-age people who support social security costs declines.
Social insurance premiums, long-term care insurance premiums, etc. are likely to be greatly reviewed in the future. Wouldn’t it be possible that long-term care insurance premiums will gradually increase from 10% to at least 20%, and then to 30%?
Originally, the framework of the current social security system was built in the 1960s and 1970s, which was a period of rapid economic growth.
At the time, there were speculations that the population would continue to grow, and erroneous predictions that the population would not reach this level of aging.
In addition, around this time, the insurance premiums deposited were more than the insurance costs, and the government bonds yielded high yields.
However, Japan is currently facing unprecedented low interest rates and rising social security costs such as long-term care insurance premiums.
I don’t think it’s an exaggeration to say that it’s completely bankrupt.
The challenge we face now is how to live in these circumstances.
Living Conditions of the Elderly
According to data released by the Ministry of Health, Labor and Welfare, in 2021, the average life expectancy for men is 81.47 years and the average life expectancy for women is 87.57 years.
Of these, 25.58 million households (2019) have an elderly person aged 65 or over, accounting for 49.4% of all households (51.78 million households).
Graphic 2: Percentage of Elderly Family Members per Household
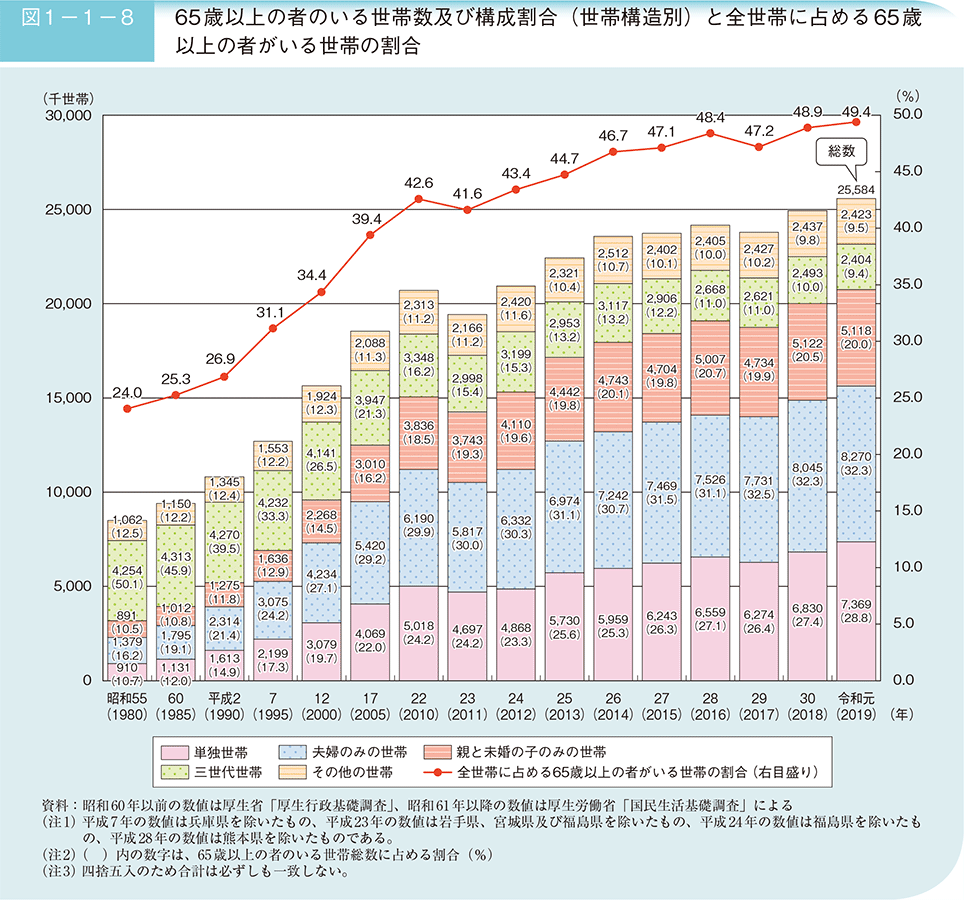
What we need to pay attention to here is the ratio of elderly single households and couples only households. There are 7.369 million single elderly households, accounting for 28.8% of the total, and 8.27 million households (32.3% of the total) are elderly couples living alone. In other words, 51.1%, or more than half, of households with elderly people live alone with the elderly.
Even if you look at the percentage of all households, one in four households is a household where only elderly people live alone.
Households with such large families are becoming rare. Comparing the ratio of three generations living together with 1980, a very remarkable figure appears.
1980: Percentage of all households with elderly people (24.0%) x Percentage of three-generation households (50.1%) = 12.0% → Percentage of 1 household in about 8 households.
2019: Percentage of all households with elderly people (49.4%) x Percentage of three-generation households (9.4%) = 4.6% → Percentage of 1 household in about 22 households.
The numbers also explain the reason why they are rarely seen.
Let’s look at the percentage of households with only elderly people in the same way.
1980: Percentage of all households with elderly people (24.0%) x Percentage of three-generation households (26.9%) = 6.45% → Percentage of 1 household in about 16 households.
2019: Percentage of all households with elderly people (49.4%) x Percentage of three-generation households (51.1%) = 25.2% → Percentage of 1 household in about 4 households.
This figure includes both rental housing and owner-occupied homes, therefore the percentage is likely to increase when considering older detached homes.
Problems of the Living Environment
Japanese houses have been built in a way that suits the climate and lifestyle of Japan.
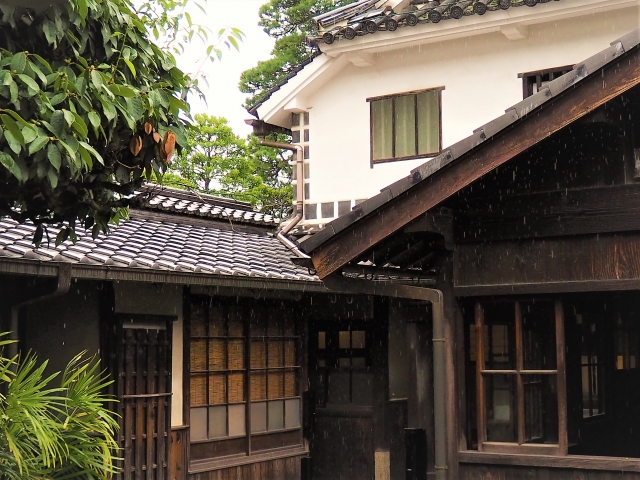
A house with tatami mats where you can feel the warmth of the wood.
At first glance, it looks like a house suitable for the elderly, but what do you think?
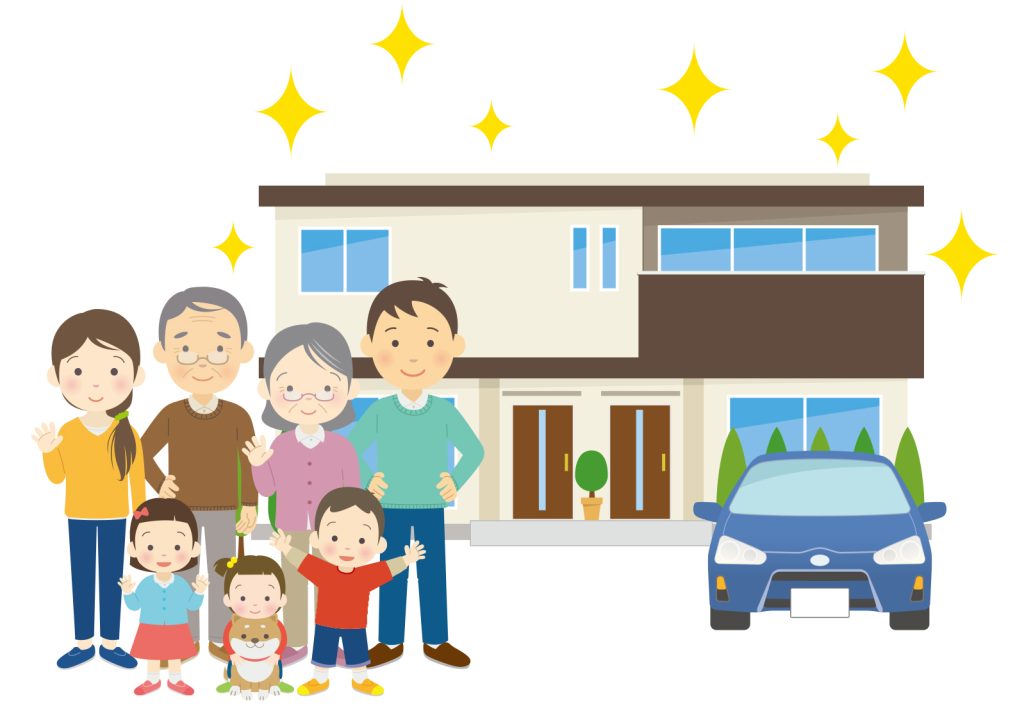
Unlike Western countries, there is a culture of taking off your shoes before entering the house, so I think there were and still are many old houses in the countryside similar to the photo above.
Realizing now that these houses were built in such a way that it is very difficult for the elderly to climb up and down.If it was an era of where the life span was between 50 and 60 years of life, this may have been suitable living environment.
But people are now calling this era, the era of the 90s and 100s (100 year life). Climbing up and down these steps at the age of 90 is hard work.
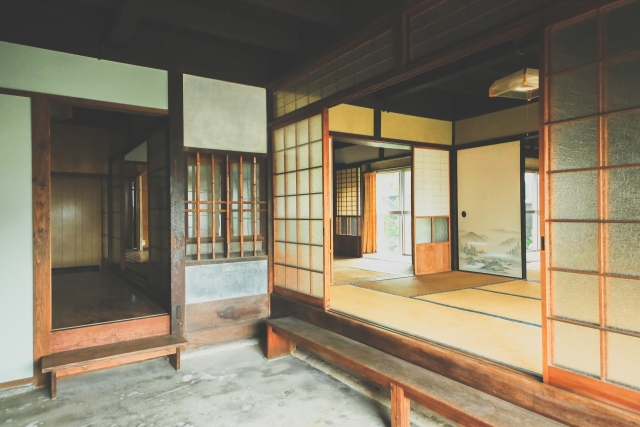
Houses with shoji screens and fusuma doors are elegant and tasteful.
Sitting and standing in a tatami room or a Japanese-style room can be difficult for the elderly.
Since most of the buildings were built according to the shakukanho, the width of the corridors is often half (910 mm), making it difficult for wheelchairs to move around.
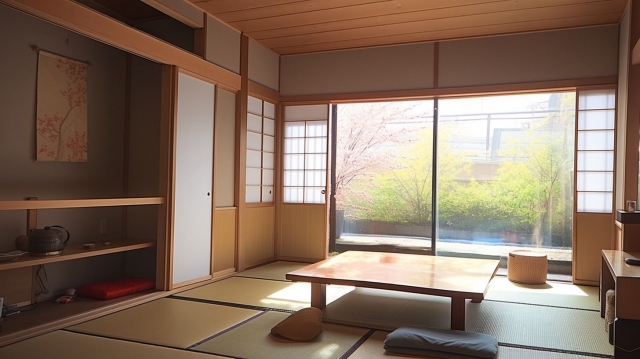
Naturally, the needs of buildings change with the times, but in this day and age, they are not very suitable for the aging society of the future.
As you get older, things like small steps that make it easy to stumble, darkness in hallways and underfoot, heights in bathrooms and toilets, etc. become more difficult to manage day to day.
This problem is called a barrier, and removing it means barrier-free.
In order to live in barrier-free housing, there are two options: renovate the existing housing to make it barrier-free, or move to a house or facility that is already barrier-free.
Either way, there are costs involved.
Raising the cost can also become a barrier in itself.
These are not the only day to day problems in an aging society. The housing environment can be considered just one of many problems faced by the elderly.
In the coming months, we will have a series of blogs on what type of programs are available for the elderly in Japan. With the foreign population growing, and the elderly foreigner population correlating with that trend, we believe this information can be of some help for those who are retired in Japan.
For additional information or any questions please contact us here
Email: info@remax-apex.com