
Real Estate Sales
The August Report was publish on September 24, 2020 for the real estate sales for the month of August 2020. The data includes the average price per square meter for listings in the Kansai region in one data set. The Kansai region includes Wakayama, Osaka, Nara, Hyogo, Kyoto, and Shiga Prefectures.
Data for Real Estate Sales will not included new construction.
The Data will be broken down into three categories:
- Condominium Sales
- House Sales
- Land Sales
Sub categories will include units sold and the number of new listings to hit the market.
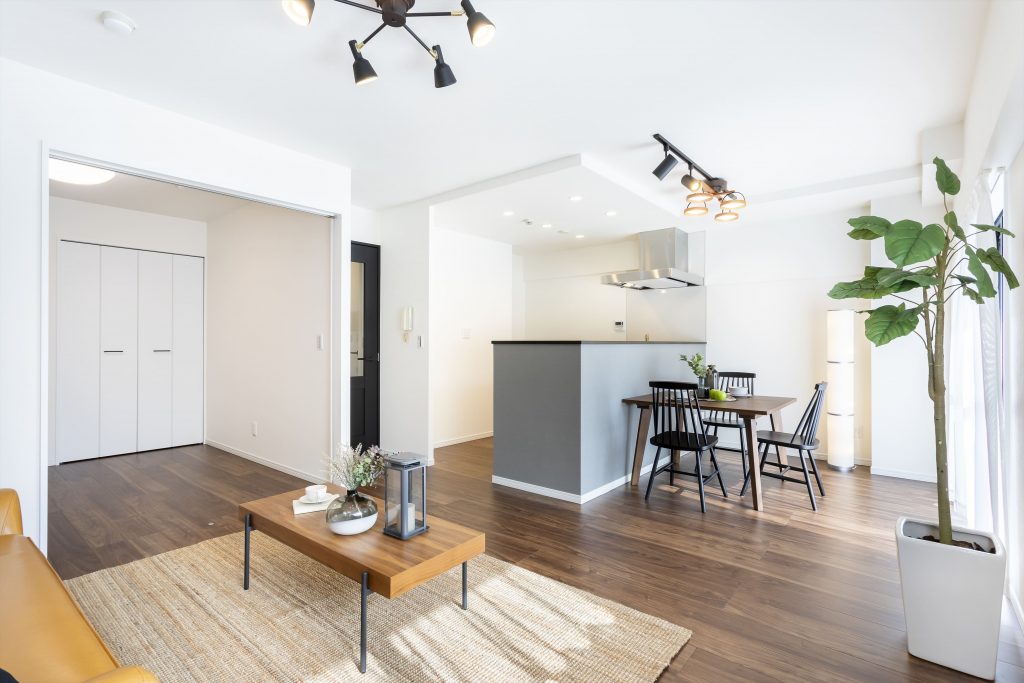
1.Condominium Sales
Kansai Region
Units Sold
August 2020: ¥345,000 per square meter a total of 1,332 units sold
August 2019: ¥328,000 per square meter a total of 1,074 units sold
Year-over-year change of 5.3% per square meter
Month-to-month change of 1.1% per square meter (July to August 2020)
New Properties Listed
August 2020: ¥393,000 per square meter a total of 4,976 units listed
August 2019: 370,000 per square meter a total of 4,779 units listed
Year-over-year change of 5.6% per square meter
Month-to-month change of 1.4% per square meter (July to August 2020)
Osaka City
Units Sold
August 2020: ¥457,000 per square meter a total of 329 units sold
August 2019: ¥443,000 per square meter a total of 279 units sold
Year-over-year change of 3.2% per square meter
Month-to-month change of -6.8%per square meter (July to August 2020)
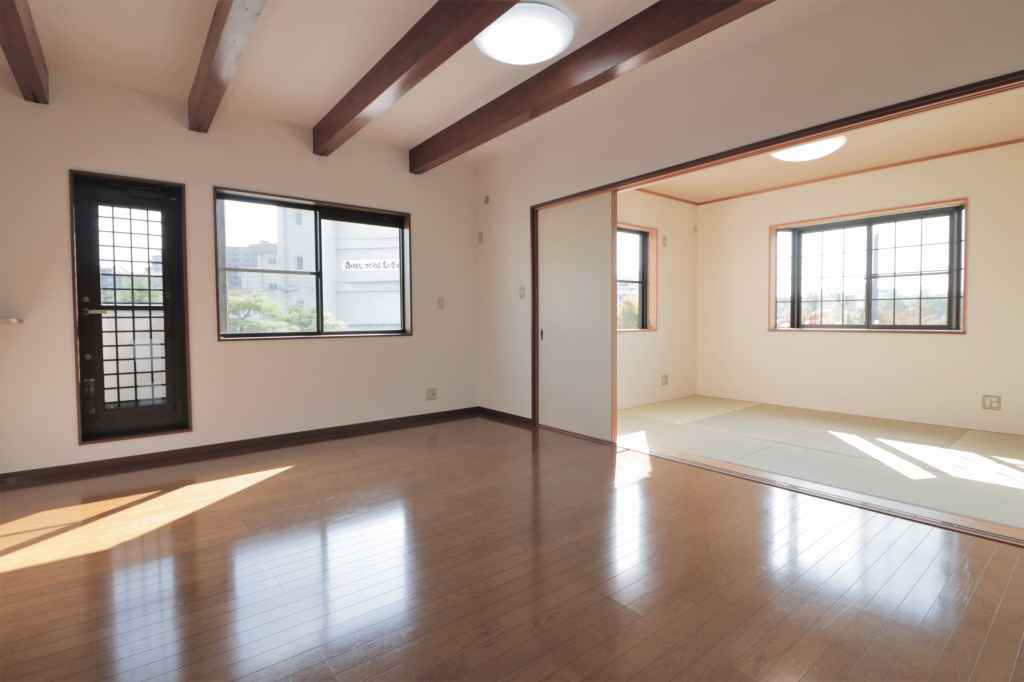
2.House Sales (Detached Homes)
Kansai Region
Homes Sold
August 2020: average price of ¥19,770,000 for a total of 823 houses sold
August 2019: average price of ¥19,78,000 for a total of 637 houses sold
Year-over-year change of -0.0% (average price)
Month-to-month change of 2.9% (average price from July to August 2020)
New Properties Listed
August 2020: average price of ¥25,580,000 for a total of 3,182 houses listed
August 2019: average price of ¥24,860,000 for a total of 3,444 houses listed
Year-over-year change of 5.0% (average price)
Month-to-month change of 4.9% (average price from July to August 2020)
Northern Osaka (Hokusetsu Area)
Homes Sold
August 2020: average price of ¥25,990,00 for a total of 63 houses sold
August 2019: average price of ¥27,240,000 for a total of 58 houses sold
Year-over-year change of -4.6% (average price)
Month-to-month change of -8.3% (average price from July to August 2020)
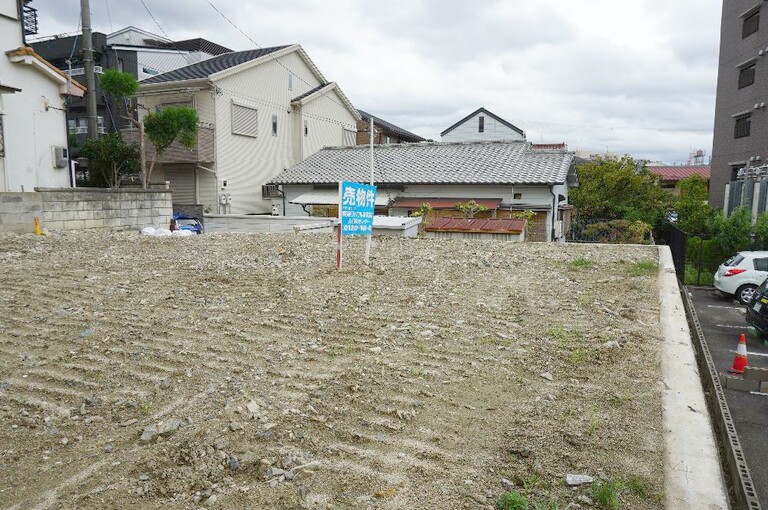
3.Land Sales
Kansai Region
Lots Sold
August 2020: average price of ¥123,000 for a total of 611 lots sold
August 2019: average price of ¥119,000 for a total of 478 lots sold
Year-over-year change of 3.3% pricer per square meter
Month-to-month change of 6.4% price per square meter (July to August 2020)
New Properties Listed
August 2020: average price of ¥141,000 for a total of 3,528 lots listed
August 2019: average price of ¥125,000 for a total of 3,640 lots listed
Year-over-year change of 12.9% price per square meter
Month-to-month change of 0.3% price per square meter (July to August 2020)
Northern Osaka (Hokusetsu Area)
Lots Sold
August 2020: average price of ¥199,000 for a total of 61 lots sold
August 2019: average price of ¥172,000 for a total of 43 lots sold
Year-over-year change of 15.8% price per square meter
Month-to-month change of 16.0% price per square meter (July to August 2020)
Market Analysis
For the condominium market the ratio of closed properties to new registrations in August was 3.97 times, and the price divergence rate of new registrations was minus 5.3%. As for the ratio, the supply and demand improved as the number of contracts increased significantly with the rate of price divergence was the same as the newly registered price.
Single Family homes, the ratio of closed properties to new listings was 1:4.32 for the month of August, with the price divergence rate at minus 20.6%. As with pre-owned condominiums, the number of contracts improved, but the price divergence rate continued to rise as the newly listed prices continued to rise, the contracted prices remained flat, and the supply and demand continued to deteriorate.
Recap
Across the board, when comparing pre-COVID numbers to COVID number we saw an increase in the number of sales when comparing data to August 2019.
Typically in a “regular” year sales in the month of August are down compared with other months. The reasoning being families typically vacation in the month of August. The priority being spending time with family which we would assume is similar in other countries.
For additional information please contact us here
Email: info@remax-apex.com
For the original data in Japanese clink here → Kinki Reins