Real Estate Sales
To better inform our clients and potential clients, we will be starting a series which will have information on the monthly sales in Osaka City and Kinki Areas. The first day will consist of data in sales the second post will be on the rental market.
Data for Real Estate Sales will not included new construction.
October Report
The October Report was publish on October 29, 2019 for the real estate sales for the month of September. The data includes the average price per square meter for listings in the Kansai region in one data set. The Kansai region includes Wakayama, Osaka, Nara, Hyogo, Kyoto, and Shiga Prefectures.
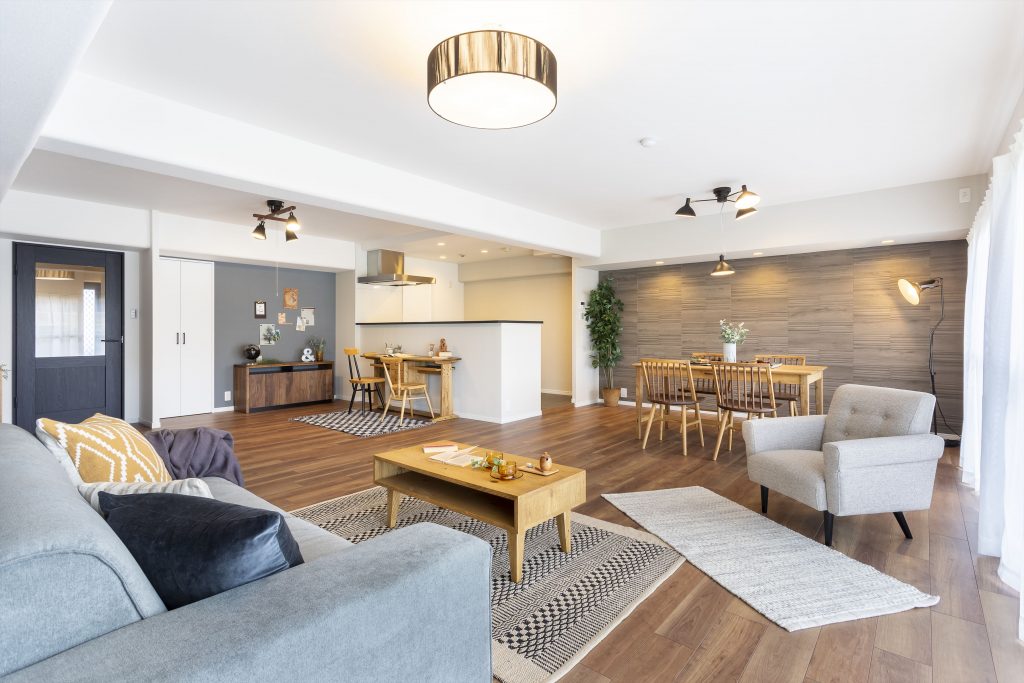
Condominium Sales
Kansai Region
Sold Units
September 2019: ¥334,000 per square meter a total of 1,582 units sold
September 2018: ¥328,000 per square meter a total of 1,438 units sold
Year-over-year change of 1.8% per square meter
Month-to-month change of 1.9% per square meter (August to September 2019)
New Properties Listed
September 2019: ¥370,000 per square meter a total of 5,626 units listed
September 2018: ¥348,000 per square meter a total of 5,588 units listed
Year-over-year change of 6.4% per square meter
Month-to-month change of -0.7% per square meter (August to September 2019)
Osaka City
Units Sold
September 2019: ¥471,000 per square meter a total of 429 units sold
September 2018: ¥448,000 per square meter a total of 341 units sold
Year-over-year change of 5.1% per square meter
Month-to-month change of 6.4% per square meter (August to September 2019)
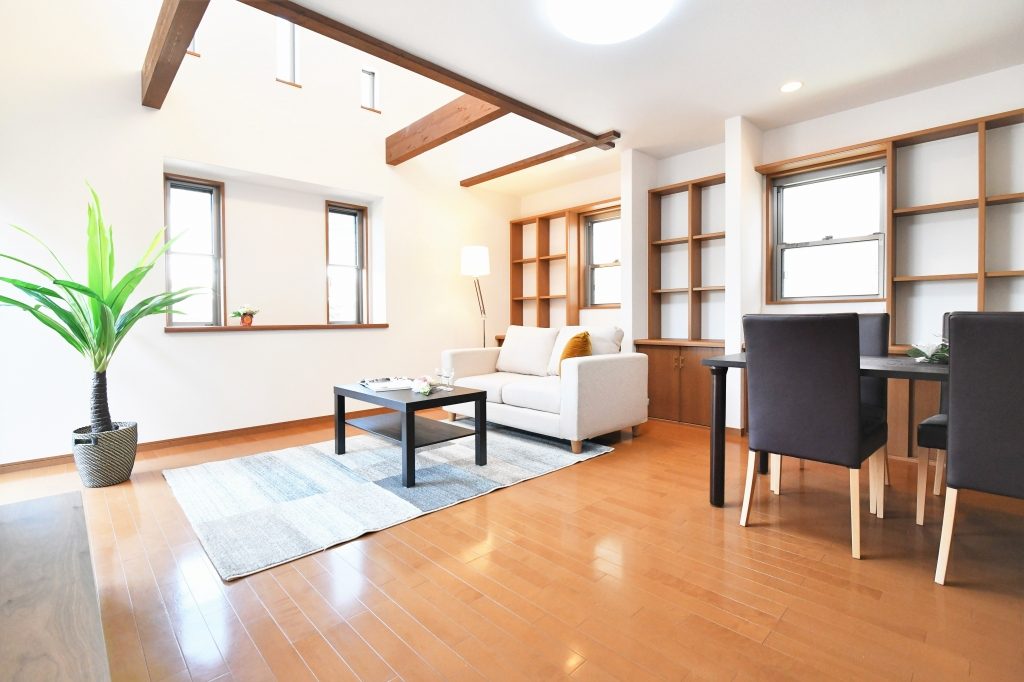
House Sales (Single Detached Homes)
Kansai Region
Houses Sold
September 2019: average price of ¥20,790,000 a total of 942 houses sold
September 2018: average price of ¥20,500,000 a total of 806 houses sold
Year-over-year change of 1.1%
Month-to-month change of 5.1% (August to September 2019)
New Properties Listed
September 2019: average price of ¥24,990,000 a total of 3,964 houses listed
September 2018: average price of ¥24,990,000 a total of 3,649 houses listed
Year-over-year change of 0% per square meter
Month-to-month change of 0.5% (August to September 2019)
Osaka City
Houses Sold
September 2019: average price of ¥24,540,000 a total of 67 houses sold
September 2018: average price of ¥30,690,000 a total of 59 houses sold
Year-over-year change of -20.0%
Month-to-month change of 13.6% (August to September 2019)
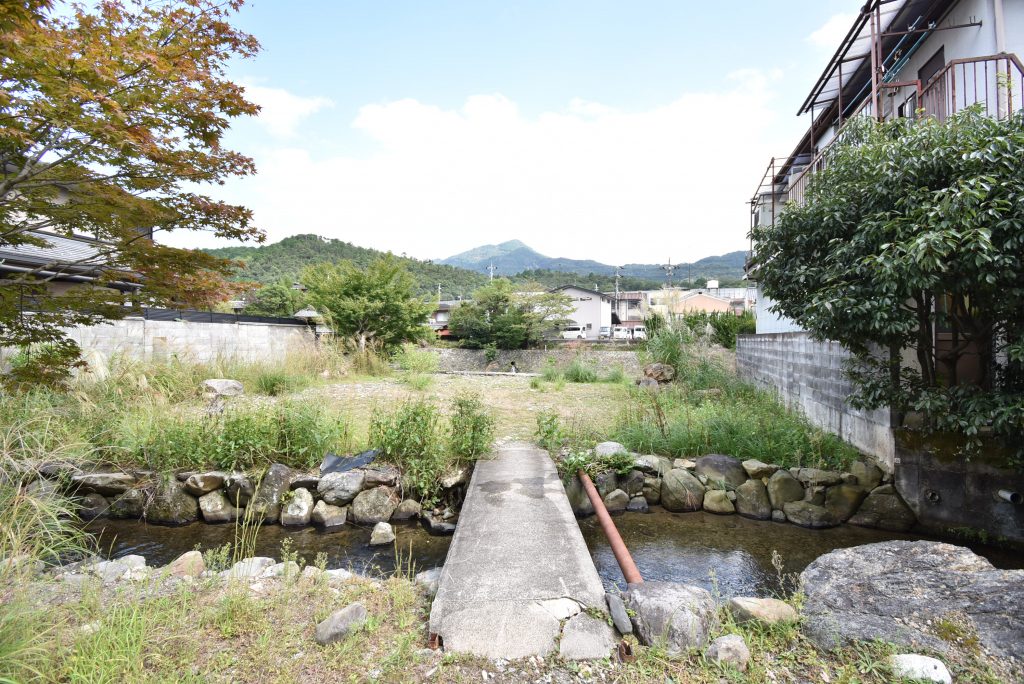
Land Sales
Kansai Region
Lots Sold
September 2019: ¥112,000 per square meter a total of 602 lots sold
September 2018: ¥119,000 per square meter a total of 572 lots sold
Year-over-year change of -5.9% per square meter
Month-to-month change of -5.6% per square meter (August to September 2019)
New Properties Listed
September 2019: ¥132,000 per square meter a total of 4,217 lots listed
September 2018: ¥102,000 per square meter a total of 3,870 lots listed
Year-over-year change of 29.3% per square meter
Month-to-month change of 5.8% per square meter (August to September 2019)
Osaka City
Lots Sold
September 2019: ¥304,000 per square meter a total of 23 lots sold
September 2018: ¥332,000 per square meter a total of 40 lots sold
Year-over-year change of -8.3% per square meter
Month-to-month change of 13.3% per square meter (August to September 2019)

Should be interesting to see the data for the upcoming months considering the consumption/sales tax increased from 8% to 10% this month on October 1st. The effect from the last increase in rates doesn’t seem to be as severe as it was back in 2014, but still should be interesting to see.
For the original data in Japanese clink here → Kinki Reins

