Real Estate Sales
The January Report was publish on March 15, 2021 for the real estate sales for the month of February 2021. The data includes the average price per square meter for listings in the Kansai region in one data set. The Kansai region includes Wakayama, Osaka, Nara, Hyogo, Kyoto, and Shiga Prefectures.
Data for Real Estate Sales will not included new construction.
The Data will be Broken Down into Three Categories:
- Condominium Sales
- House Sales
- Land Sales
Sub categories will include units sold and the number of new listings to hit the market.
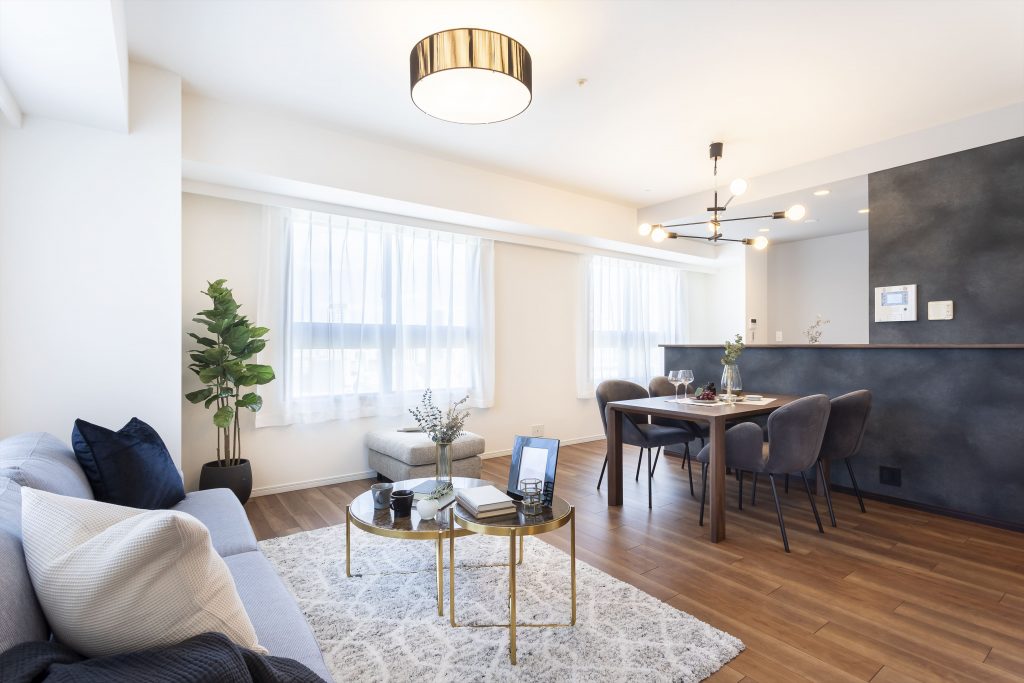
1.Condominium Sales
Kansai Region
Units Sold
February 2021: ¥354,800 per square meter a total of 1,544 units sold
February 2020: ¥341,100 per square meter a total of 1,651 units sold
Year-over-year change of 3.9% per square meter
Month-to-month change of -1.7% per square meter (January to February)
February 2021: ¥24,910,000 average price
February 2020: ¥23,690,000 average price
Year-over-year change of 5.1%
Month-to-month change of -0.6% (January to February)
Average Floor Area: 70.20m2
Average Age: 24.09 years
New Properties Listed
February 2021: ¥400,700 per square meter a total of 4,989 units listed
February 2020: ¥382,300 per square meter a total of 5,544 units listed
Year-over-year change of 4.8% per square meter
Month-to-month change of 3.4% per square meter (January to February)
February 2021: ¥24,990,000 average price
February 2020: ¥24,620,000 average price
Year-over-year change of 0.6%
Month-to-month change of 1.8% (January to February)
Average Floor Area: 62.37m2
Average Age: 24.05 years
Total Inventory
February 2021: 15,806 total units at ¥389,900 per square meter
February 2020: 17,380 total units at ¥367,100 per square meter
Year-over-year change of 6.2% per square meter
Month-to-month change of 0.6% per square meter (January to February)
Osaka City
Units Sold
February 2021: ¥501,600 per square meter a total of 379 units sold
February 2020: ¥477,600 per square meter a total of 384 units sold
Year-over-year change of 5.0% per square meter
Month-to-month change of 1.1% per square meter (January to February)
February 2021: ¥31,930,000 average price
February 2020: ¥30,300,000 average price
Year-over-year change of 5.4%
Month-to-month change of 0.3% (January to February)
Average Floor Area: 63.66m2
Average Age: 22.03 years
New Properties Listed
February 2021: ¥539,800 per square meter a total of 1,684 units listed
February 2020: ¥523,500 per square meter a total of 1,765 units listed
Year-over-year change of 3.1% per square meter
Month-to-month change of -0.5% per square meter (January to February)
February 2021: ¥27,550,000 average price
February 2020: ¥28,980,000 average price
Year-over-year change of -4.9%
Month-to-month change of -1.0% (January to February)
Average Floor Area: 51.03m2
Average Age: 21.04 years
Northern Osaka (Hokusetsu Area)
Units Sold
February 2021: ¥330,600 per square meter a total of 198 units sold
February 2020: ¥346,500 per square meter a total of 218 units sold
Year-over-year change of -4.6% per square meter
Month-to-month change of -5.9% per square meter (January to February)
February 2021: ¥24,650,000 average price
February 2020: ¥25,790,000 average price
Year-over-year change of -4.4%
Month-to-month change of -7.4% (January to February)
Average Floor Area: 74.54m2
Average Age: 26.08 years
New Properties Listed
February 2021: ¥367,800 per square meter a total of 480 units listed
February 2020: ¥342,500 per square meter a total of 636 units listed
Year-over-year change of 7.4% per square meter
Month-to-month change of 10.4% per square meter (January to February)
February 2021: ¥27,710,000 average price
February 2020: ¥25,810,000 average price
Year-over-year change of 7.4%
Month-to-month change of 9.7% (January to February)
Average Floor Area: 75.34m2
Average Age: 27.05 years
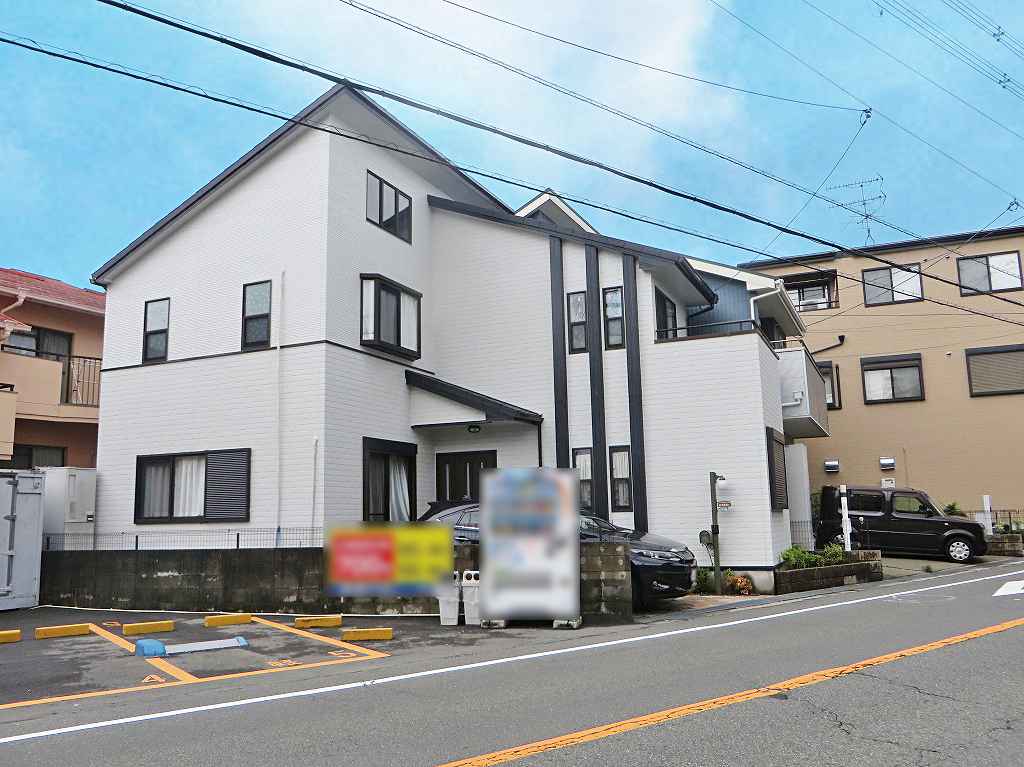
2.House Sales (Detached Homes)
Kansai Region
Homes Sold
February 2021: average price of ¥21,120,000 for a total of 897 homes sold
February 2020: average price of ¥20,490,000 for a total of 948 homes sold
Year-over-year change of 3.0% (average price)
Month-to-month change of 6.7% (average price from January to February)
Average Land Area: 134.77m2
Average Building Area: 106.17m2
Average Age: 25.01 years
New Homes Listed
February 2021: average price of ¥25,970,000 for a total of 3,087 houses listed
February 2020: average price of ¥25,840,000 for a total of 3,930 houses listed
Year-over-year change of 0.5% (average price)
Month-to-month change of -2.0% (average price from January to February)
Average Land Area: 139.65m2
Average Building Area: 111.43m2
Average Age: 26.04 years
Total Inventory
January 2021: 12,420 with an average price of ¥24,950,000
January 2020: 15,072 with an average price of ¥24,000,000
Year-over-year change of 4.0% (average price)
Month-to-month change of 1.0% (average price from January to February)
Average Land Area: 142.74m2
Average Building Area: 200.41m2
Average Age: 27.09 years
Northern Osaka (Hokusetsu Area)
Homes Sold
February 2021: average price of ¥30,220,000 for a total of 74 homes sold
February 2020: average price of ¥27,480,000 for a total of 79 homes sold
Year-over-year change of 10.0% (average price)
Month-to-month change of 9.4% (average price from January to February)
Average Land Area: 130.98m2
Average Building Area: 109.62m2
Average Age: 20.02 years
New Properties Listed
February 2021: average price of ¥32,990,000 for a total of 248 homes sold
February 2020: average price of ¥34,320,000 for a total of 304 homes sold
Year-over-year change of -3.9% (average price)
Month-to-month change of -10.9% (average price from January to February)
Average Land Area: 135.70m2
Average Building Area: 116.19m2
Average Age: 24.09 years
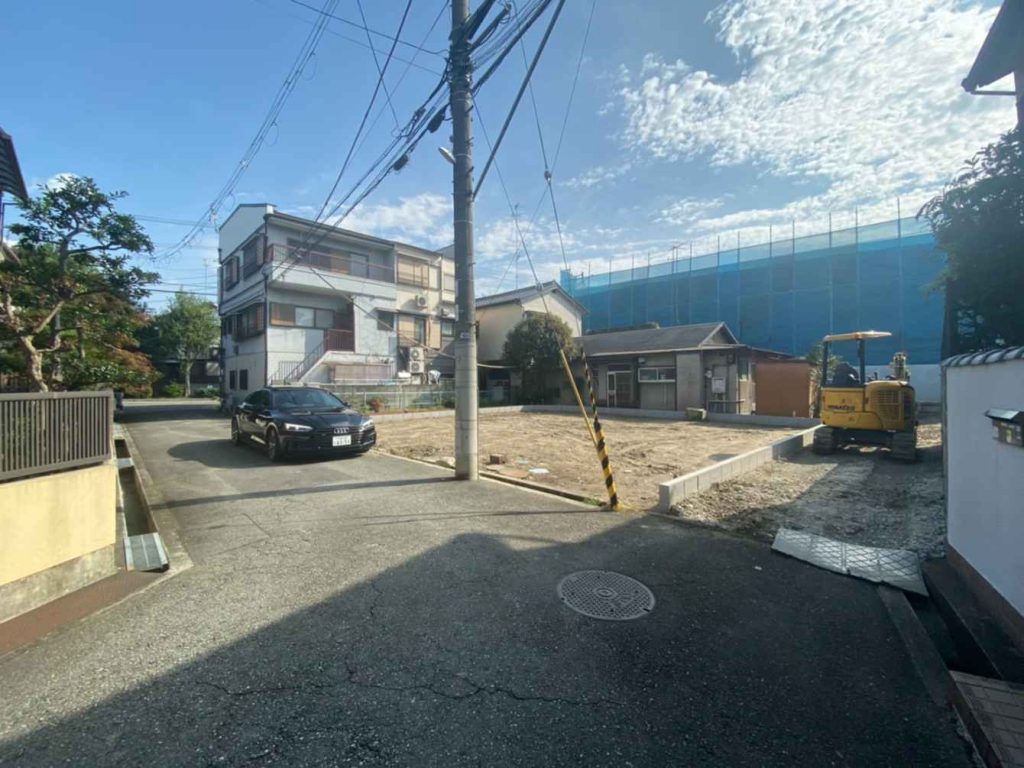
3.Land Sales
Kansai Region
Lots Sold
February 2021: average price of ¥123,600 for a total of 560 lots sold
February 2020: average price of ¥116,500 for a total of 631 lots sold
Year-over-year change of 6.1% price per square meter
Month-to-month change of 3.7% price per square meter (January to February)
February 2021: ¥20,440,000 average price
February 2020: ¥18,770,000 average price
Year-over-year change of 8.9%
Month-to-month change of 4.9% (January to February)
Average Land Area: 165.27m2
New Properties Listed
February 2021: average price of ¥137,600 for a total of 2,988 lots listed
February 2020: average price of ¥136,100 for a total of 4,024 lots listed
Year-over-year change of 1.1% price per square meter
Month-to-month change of 0.7% price per square meter (January to February)
February 2021: ¥22,850,000 average price
February 2020: ¥22,590,000 average price
Year-over-year change of 1.2%
Month-to-month change of 0.9% (January to February)
Average Land Area: 166.13m2
Total Inventory
February 2021: 15,852 total lots at ¥105,100 per square meter
February 2020: 18,468 total lots at ¥107,500 per square meter
Year-over-year change of -1.9% per square meter
Month-to-month change of -0.4% per square meter (January to February)
February 2021: ¥18,41,000 average price
February 2020: ¥18,660,000 average price
Year-over-year change of -1.0%
Month-to-month change of -0.4% (January to February)
Average Land Area: 175.21m2
Northern Osaka (Hokusetsu Area)
Lots Sold
February 2021: ¥212,500 per square meter for a total of 50 lots sold
February 2020: ¥178,000 per square meter for a total of 60 lots sold
Year-over-year change of 19.4% pricer per square meter
Month-to-month change of 4.4% price per square meter (January to February)
February 2021: ¥32,530,000 average price
February 2020: ¥25,210,000 average price
Year-over-year change of 29.1%
Month-to-month change of 3.9% (January to February)
Average Land Area: 153.10m2
New Properties Listed
February 2021: ¥200,100 per square meter for a total of 216 lots sold
February 2020: ¥213,100 per square meter for a total of 416 lots sold
Year-over-year change of -6.1% pricer per square meter
Month-to-month change of -3.4% price per square meter (January to February)
February 2021: ¥32,900,000 average price
February 2020: ¥31,870,000 average price
Year-over-year change of 3.2%
Month-to-month change of 7.2% (January to February)
Average Land Area: 164.38m2

Market Analysis
Condominiums
February 2020 was just before the first wave from COVID-19 hit Japan. Condominiums sales in February were quite comparable when comparing the data from February 2020. The total number of sales decreased, but an increase in unit price and average price was observed.
In Osaka City, Kita-ku, Naniwa-ku, Sumiyoshi-ku, and Hirano-ku observed increases in every data point tracked in this report for the month of February. In Northern Osaka, Minoh City observed an increase in every data point.
Overall inventory decreased by a total 106 units compared to January, and a decrease of 1,574 units.
Osaka Prefecture observed a decrease of a total 20 units compared to January, and a decrease of 581 units.
The year over year trend continues, for six consecutive months we have observed a decrease in new properties listed. Although, 40 more units were listed as a whole compared to January, and a total of 98 more units in Osaka compared to January.
Detached Homes
Detached home sales experienced an increase in every category except total sales (897) and average building area (106.17m2), a year to year decrease of 5.4% and a month to month decrease of 1.3% respectively.
Osaka Prefecture observed an increase in every category except average building area (104.10m2), a month to month change decrease of 3.1%.
For the 11th consecutive month, the Kansai Region has observed a year to year decrease new homes to the market. Osaka Prefecture has observed a year to year decrease in new homes for sale 10 months out of the last 11.
Similarly to condominiums, overall inventory decreased by 114 homes (month to month) and a decrease of 2,652 homes (year to year) with percent change in the negative for the 8th consecutive month.
Osaka Prefecture observed a decrease in overall inventory by 95 homes (month to month) and a decrease of 944 homes (year to year) with percent change in the negative for the 6th consecutive month.
On a positive note, Northern Osaka observed an increase in 10% year over year and a 9.4% increase month over month for average prices.
For additional information please contact us here
Email: info@remax-apex.com

