Real Estate Sales
The November Report was publish on November 25, 2020 for the real estate sales for the month of October 2020. The data includes the average price per square meter for listings in the Kansai region in one data set. The Kansai region includes Wakayama, Osaka, Nara, Hyogo, Kyoto, and Shiga Prefectures.
Data for Real Estate Sales will not included new construction.
The Data will be broken down into three categories:
- Condominium Sales
- House Sales
- Land Sales
Sub categories will include units sold and the number of new listings to hit the market.
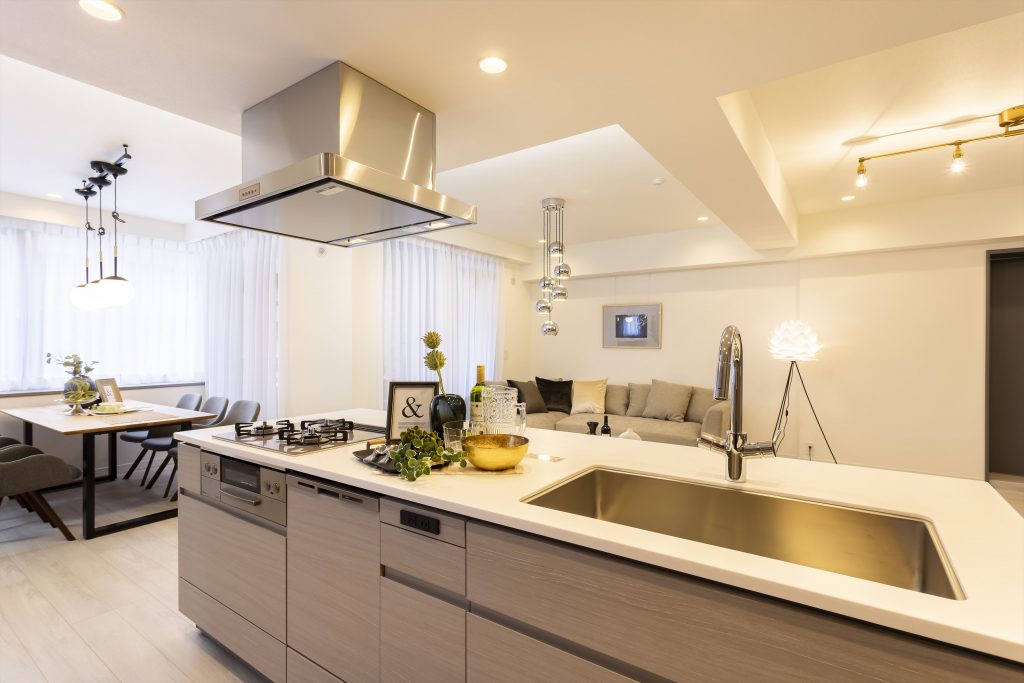
1.Condominium Sales
Kansai Region
Units Sold
October 2020: ¥343,800 per square meter a total of 1,507 units sold
October 2019: ¥344,400 per square meter a total of 1,502 units sold
Year-over-year change of -0.2% per square meter
Month-to-month change of 1.9% per square meter (September to October 2020)
New Properties Listed
October 2020: ¥389,700 per square meter a total of 4,928 units listed
October 2019: ¥372,700 per square meter a total of 5,443 units listed
Year-over-year change of 4.6% per square meter
Month-to-month change of 0.0% per square meter (September to October 2020)
Osaka City
Units Sold
October 2020: ¥473,000 per square meter a total of 362 units sold
October 2019: ¥479,000 per square meter a total of 365 units sold
Year-over-year change of -1.3% per square meter
Month-to-month change of 1.0% per square meter (September to October 2020)
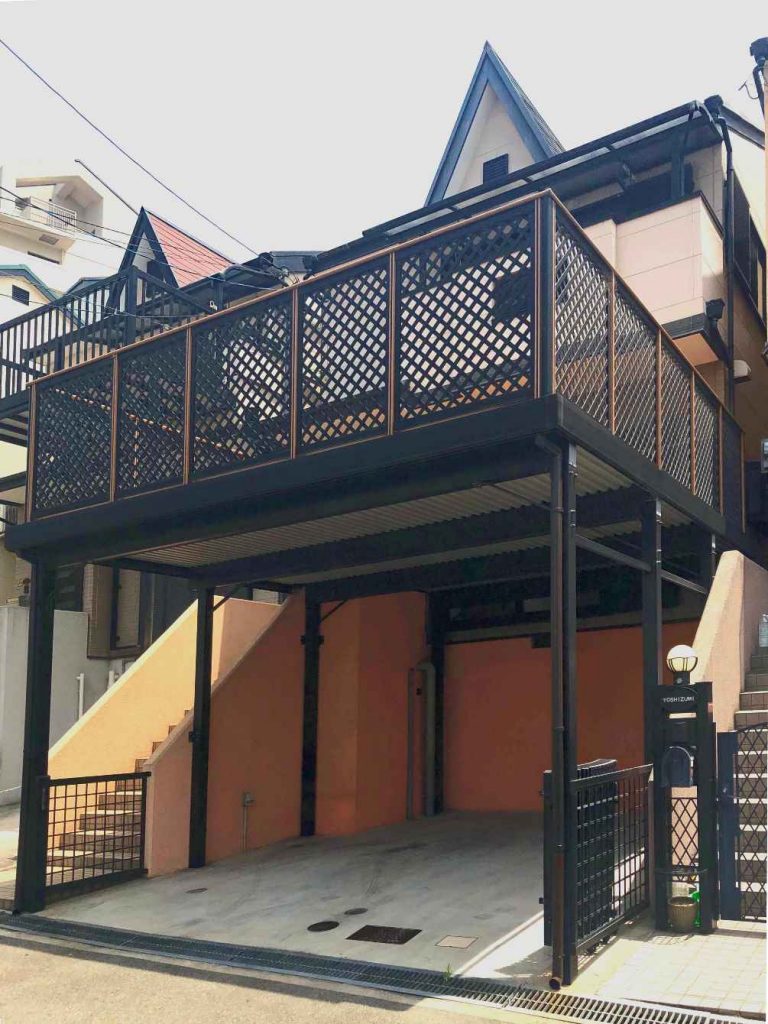
2.House Sales (Detached Homes)
Kansai Region
Homes Sold
October 2020: average price of ¥19,880,000 for a total of 891 houses sold
October 2019: average price of ¥19,970,000 for a total of 846 houses sold
Year-over-year change of -0.5% (average price)
Month-to-month change of -2.7% (average price from September to October 2020)
New Properties Listed
October 2020: average price of ¥26,020,000 for a total of 3,296 houses listed
October 2019: average price of ¥24,990,000 for a total of 3,979 houses listed
Year-over-year change of 4.2% (average price)
Month-to-month change of 0.9% (average price from September to October 2020)
Northern Osaka (Hokusetsu Area)
Homes Sold
October 2020: average price of ¥30,010,000 for a total of 76 houses sold
October 2019: average price of ¥27,910,000 for a total of 63 houses sold
Year-over-year change of 7.8% (average price)
Month-to-month change of 3.2% (average price from September to October 2020)
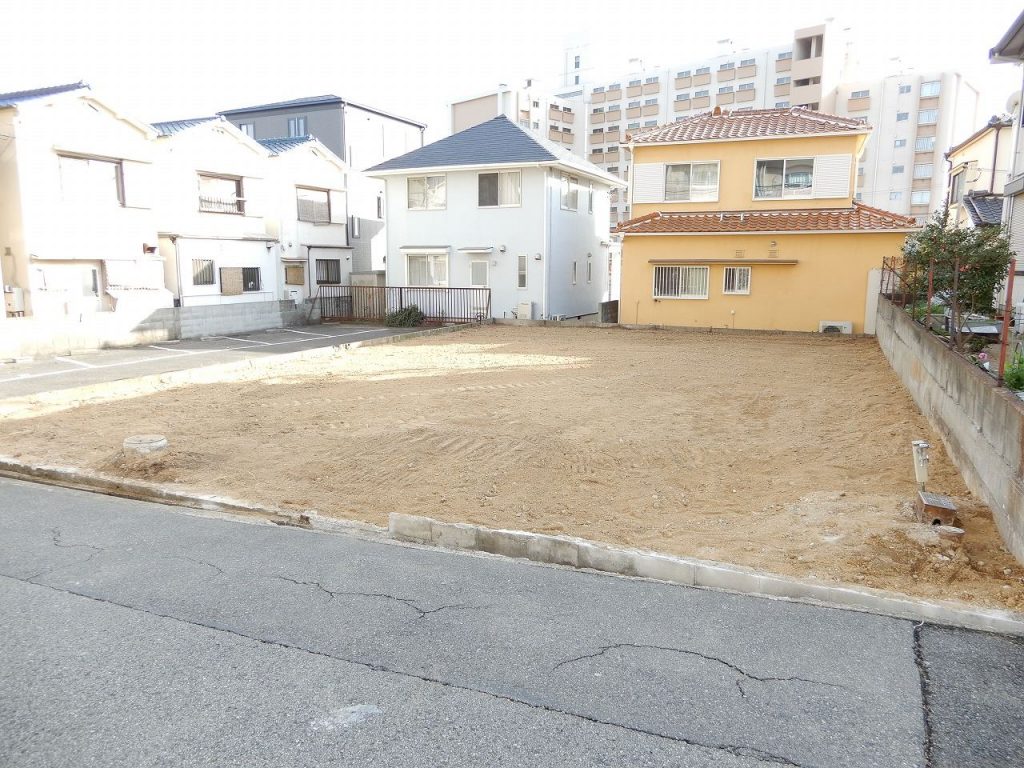
3.Land Sales
Kansai Region
Lots Sold
October 2020: average price of ¥120,700 for a total of 663 lots sold
October 2019: average price of ¥121,600 for a total of 582 lots sold
Year-over-year change of -0.8% pricer per square meter
Month-to-month change of 1.7% price per square meter (September to October 2020)
New Properties Listed
October 2020: average price of ¥133,100 for a total of 3,494 lots listed
October 2019: average price of ¥134,400 for a total of 4,189 lots listed
Year-over-year change of -1.0% price per square meter
Month-to-month change of -0.4% price per square meter (September to October 2020)
Northern Osaka (Hokusetsu Area)
Lots Sold
October 2020: average price of ¥212,00 for a total of 58 lots sold
October 2019: average price of ¥188,000 for a total of 48 lots sold
Year-over-year change of 12.5% pricer per square meter
Month-to-month change of 2.3% price per square meter (September to October 2020)

Market Analysis
Condominiums
The ratio of the number of sales to new listings in October was 1:3.93, and the price divergence rate of new registrations was minus 5.3%. The trend for supply and demand as improved with the number of new listings decreasing with the number of sales increasing. As for the price divergence rate, the contract price and the newly registered price increased at the same level, and the supply and demand remained flat.
In October, the listed price per square meter increased by 4.6% year-on-year to 389,700 yen/m², surpassing the previous year’s results for 42 consecutive months. This dates back to May 2017. The month-on-month change was flat. The unit price of newly listed properties remained at the 390,000 yen level, which were the unit price points back in March 1996.
Detached Homes
The ratio of sales to new listings for the month of October was 1:4.2, and the price divergence rate was minus 21.3%. As for the ratio, the number of new registrations decreased while the number of contracts increased, and the supply and demand continued to improve. On the other hand, as for the price divergence rate, the new registration price continued to rise while the contract price fell, and the supply and demand deteriorated further.
The new listings price in October was 26.02 million yen, up 4.2% from the previous year, surpassing the same month last year for 16 consecutive months. The month-on-month rate was also + 0.9%. Unlike the contract price, the selling price is on an upward trend, and the gap between the two is widening.
Recap
We are starting to feel and notice the lack of new inventory coming into the market, especially family oriented units (more so condominiums). We feel this is both for sales and rent. With the work at home policy a majority of companies have put in place, the movement within companies have decreased, typically occurs in the spring and fall. With the lesser movement in rentals, new inventory to the market has been stagnate. With sales, buyers are still being cautious and taking the “waiting and see” approach.
Japan has entered the third wave for COVID-19, with cases hitting a record high. We will continue to monitor COVID-19 and are curious about the general movement which comes with the new business/school year next April.
Prices in Kyoto has stabilized as well. Professionals in the Kyoto market has mentioned in the past that it was a seller’s market, an extreme seller’s market. With COVID, the prices have come back down to reality with a ton of wiggle room for negotiations.
Again, with all the analysis aside, we continue to see numbers which are close to pre-COVID numbers (comparing year over year).
For additional information please contact us here
Email: info@remax-apex.com
For the original data in Japanese clink here → Kinki Reins

